Modalanalyse-Software EDM Modal
Betriebsschwingform- und experimentelle Modalanalysen nach Datenimport oder Erfassen von Übertragungsfunktionen mit CoCo oder Spider Systemen
Übersicht
EDM Modal ermöglicht Betriebsschwingformanalysen und experimentelle Modalanalysen:
- Betriebsschwingformanalyse (ODS – Operating Deflection Shapes) zur Ermittlung und Visualisierung der Schwingungsformen einer Struktur bei Betriebsanregung, ohne dass die anregenden Kräfte explizit gemessen werden müssen. Modale Parameter wie Eigenfrequenzen und Dämpfungen werden hier nicht berechnet.
- Klassische Experimentelle Modalanalyse (EMA – Experimental Modal Analysis) zur Ermittlung der Eigenfrequenzen, Dämpfungen und Schwingungsformen einer Struktur bei Anregung durch Impulshammer oder Shaker.
Besondere Merkmale
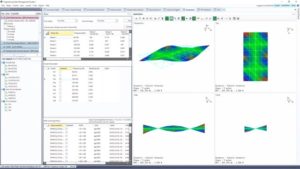
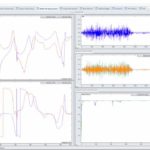
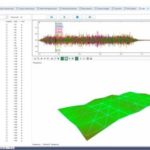
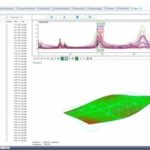
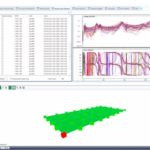
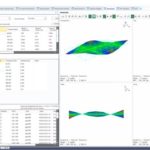
EDM Modal ist ein intuitiv bedienbares Programm für die Analyse von Schwingungen. Es ermöglicht die Analyse, Darstellung und Dokumentation des dynamischen Verhaltens von Maschinen und Strukturen, die räumliche Darstellung des 3D-Modells einer schwingenden Struktur sowie die Darstellung von Schwingungsdaten (Betriebsschwingungen, Modal-Schwingungen). Der Anwender kann sich per Mausklick durch die Messungen bewegen und die animierte Darstellung des Modells beobachten. Daten aus dem Zeitbereich lassen sich für die Animation von Betriebsschwingungen ebenso verwenden wie Daten aus dem Frequenzbereich, z.B. für die Untersuchung einer Struktur bei einer bestimmten Frequenz oder im Verlauf einer Ordnung.
Das Programm verarbeitet u.a. UFF Dateien mit Geometrien, Zeit- und Frequenzbereichs-Daten (die z.B. mit den Handheld Signal Analysatoren der CoCo-80 Serie erfasst wurden) und ist somit universell einsetzbar. Darüber hinaus bietet es optimierte Funktionen zu Erfassung von Übertragungsfunktionen im Rahmen von Hammer- oder Shaker-Tests mit den Dynamischen Signal Analysatoren der Spider Serie.
NEU: Multi-Resolution Spectral Analysis sorgt für 8-fach höhere Auflösung im unteren Frequenzbereich
Software-Elemente
EDM Modal besteht aus folgenden Elementen:
EMA-01 Geometry/ODS/Animation
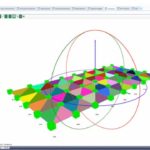
EDM Modal Geometry/ODS/Animation is the primary software module required for every EDM Modal system. This option provides fast and efficient structural model generation and full 3D visualization of test and analysis results. The base elements (points, lines, and surfaces) can be added/deleted graphically, or through the typed Model Editor entry. Components can be specified for each part of the structure. Each component can have its own origin as well as its own directions and Euler angles. The basic component library includes: line, plane, cube, cylinder and sphere. Any of these can be added to the geometry model by specifying origin, direction, dimensions, and the number of cells of the component.
EMA-01-01 3D Model Reconstruction
The 3D Model Reconstruction software produces 3D geometric models of complex test structures using a selection of 2D photos. Modelling intricate structures is not only challenging because of the complexity involved in measuring the x, y, z coordinates but it is also very demanding as it is very difficult and time consuming. This 3D reconstruction software provides a simple solution to these problems.The captured images are matched to extract the features and a 3D model of the structure is constructed after point (sparse and dense) and surface reconstruction processes.
NEU: Geometrie-Erstellung aus 2D-Fotos und einfache Darstellung von Schwingformen mittels Vibration Visualization
EMA-02 Hammer Impact Modal Testing
EDM Modal Hammer Impact Testing provides the necessary features for a single-operator experimental modal test. The Hammer Impact GUI features an intuitive step-by-step process, allowing users to easily go through the setup and testing. The testing process has been designed to help users quickly define acquisition parameters, so that more time can be spent on analysis. Users can define trigger behavior through the Trigger Setup; a Trigger-Preview window allows control over the trigger level and pre-trigger delay. For users that may need to review their measurements after each acquired frame, the ‘Manual-Arm’ trigger mode can be used. When this trigger mode is selected, acquired signals will be displayed for review and will prompt the user to accept/reject the signal.
Driving Point Selection will help users decide where to place the fixed excitation or response reference. The idea here is to survey several candidate driving-points, measure their FRFs – this allows you to choose the best available DOF for the driving point. The FRF at the trial driving-point which best excites most of modes can be selected as the driving-point.
EMA-03 SIMO FRF Modal Testing und EMA-04 MIMO FRF Modal Testing
EDM Modal Single Input Multiple Output (SIMO) and Multiple-Input Multiple-Output (MIMO) FRF Testing includes a dedicated test setup and operation process flow using single or multiple shakers to acquire FRF signals. Using a large channel count Spider data acquisition system (up to 512 channels) this shaker excitation method provides much higher test execution efficiency for the FRF measurements.
The Source Output type supports pure random (white noise), burst random, Chirp/Burst Chirp, pseudo random, and periodic random. For periodical random types (pseudo random and periodical random), the delay block and cyclic block numbers can be set for the purpose of bringing the structure to steady state response prior to each data acquisition. This will result in leakage-free measurements that do not require the use of a tapering window function.
When using multiple shaker random excitation applications, the shaker-driving source signals are guaranteed to be uncorrelated with one another. The source output type supports pure random (white noise), burst random, chirp/burst chirp, pseudo random, and periodic random.
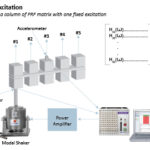
Multiple shaker excitation is useful to separate and clearly identify repeated roots and frequency-proximate modes. With more than one reference shaker, multiple columns of the Frequency Response Matrix can be measured simultaneously. Combined with the poly reference curve fitting algorithm, the modal participation factor will help to isolate the repeated and highly coupled modes.
The ‘Multi-resolution’ spectrum type applies multiple passes of FFT to yield a much finer resolution in the lower frequency region. This algorithm improves the frequency resolution by 8 times in the low frequency region which is 1/8th of the frequency analysis range. This provides the advantage of better estimation of the damping (or quality factor) and amplitude of the frequency response functions at the resonant frequencies.
EMA-05 SIMO Stepped Sine Modal Testing und EMA-06 MIMO Stepped Sine Modal Testing
EDM Modal SIMO and MIMO Stepped Sine Modal Testing includes a dedicated test setup and operation process flow using a single shaker or multiple shakers outputting a stepped sine wave to acquire FRF signals. Using a large channel count data acquisition system (i.e., Spider-80X or Spider-80Xi), this shaker excitation method provides much higher test execution efficiency for FRF measurements.
The Source Output type is Sine tone. From the name of Stepped Sine, data at one frequency will be measured at a time. Stepping through the defined points, either linear or logarithmic spaced, the FRF signals of each measurement DOFs with respect to the defined reference channel will be constructed.
EMA-35 SIMO Swept Sine Modal Testing und EMA-36 MIMO Swept Sine Modal Testing
EDM Modal SIMO and MIMO Swept Sine Modal Testing includes a dedicated test setup and operation process flow using a single shaker or multiple shakers outputting a swept sine wave to acquire FRF signals or to test the device under test. Using a large channel count data acquisition system (i.e., Spider-80X or Spider-80Xi), this shaker excitation method provides much higher test execution efficiency for FRF measurements and minimizes the crest factor of applied forces.
The Source Output is Sine tone. From the name of Swept Sine, the frequency of the sine tone is sweeping from the start frequency to the end frequency defined. Sweeping through the defined frequency range at the level defined, either linear or log spaced, the FRF signals of each measurement points with respect to the defined reference channel will be constructed.
EMA-07 MIMO Normal Mode Sine Modal Testing
Normal Mode modal testing to tune a “Pure” mode on the UUT with multiple shakers.
EMA-08 Operational Modal Testing
EDM Modal Operational Modal Testing includes a dedicated test setup and operation process flow to acquire ambient vibration signals. Using a large channel count data acquisition system (i.e., Spider-80X or Spider-80Xi), this shaker excitation method provides much higher test execution efficiency for measurements.
The Operational Modal Analysis (OMA) takes advantage of natural excitations from ambient forces or operational loads, (i.e., wind, traffic, etc.,) which makes possible the dynamic identification of large civil structures or operating machineries. EDM Operational Modal Testing provides response data acquisition, response data processing, and readies data for modal parameter identification.
Due to its response-only nature, special processing is carried out to process the vibration data before the modal model is identified. The ‘scaling’ feature uses the reference point response data. Multiple references can be used in this operational modal analysis suite. The ‘SSI’ modal parameter estimation method, a dedicated curve fitting method for OMA data allows the user to extract the modal parameters, as well as the other curve fitting methods.
EMA-11 Standard Modal Analysis
EDM Standard Modal Analysis provides the user with complete features, from FRF data selection and parameter identification to results validation and mode shape animation.
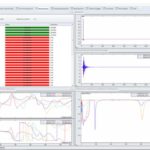
Upon completion of Modal testing, the resulting set of FRF data is made available for the next step: Modal Analysis. You can also add/replace individual FRF signals. The complete set of FRF test signals can be exported or imported from other sources. These operations are managed by ‘Modal Data Selection’. The FRF signals are organized for a rapid comprehensive review, individual review, or multiply in one graph window.
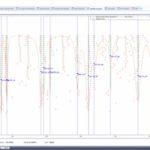
With one click, the Modal Parameter Identification process can be started. With the help of a Mode Indicator Function (MIF), the natural frequencies can be labeled. The Multivariate, Complex, Real, and Imaginary Sum MIFs are available. MIF indicators aide identifying repeated roots (repeated poles) and closely-spaced distinct roots.
A Stability Diagram is employed with modal parameter identification. With the Standard Modal Analysis option, the proven Least Square Complex Exponential (LSCE) fitter is implemented for pole identification. The physical poles sought are stable (as opposed to ‘computational poles’ sometimes produced by the LSCE) and can be selected from the Stability Diagram for the next step mode shape calculation, using the Least Square Frequency Domain (LSFD) algorithm.
The resulting mode shape table can be saved and used for mode shape animation. Modal Assurance Criterion (MAC) function and FRF synthesis are also available. These provide means for modal parameter validation.
EMA-15 Poly Reference Curve Fitter
EMA-15 provides the Poly-reference modal analysis algorithm to curve fit the FRF matrix from the MIMO FRF testing results. The time domain curve fitting algorithm for the pole identification is the sophisticated and proven Poly reference time domain method (PTD).
The selection of the curve fitting method, PTD or LSCE, is automatically based on the type of FRF signal set selected, whether it is a single reference or multi-reference.
Needed for applications with more than 1 sensor = multiple references.
EMA-16 Poly-X Curve Fitter
EMA-16 provides the Poly-X modal analysis algorithm to curve fit the FRF matrix from the MIMO FRF testing results. It is the frequency domain curve fitting algorithm for the pole identification, Poly reference least square frequency domain (p-LSCF), which is more efficient and neater.
The selection of the curve fitting method, Time domain or Poly-X, is available from the Band Selection tab, per software options available.
EMA-11 and EMA-15 have only time domain based curve fitters (LSCE and PTD respectively.) For frequency domain based curve fitting method, EMA-16 is required. Frequency domain based curve fitting method, Poly-X method, is called p-LSCF method.
EMA-14 Operational Curve Fitter
As an dedicated curve fitting method for Operational Modal Analysis, the Stochastic Subspace Identification (SSI) modal parameter estimation method is not only cleaner but more efficient as well.
EMA-21 Correlation Analysis
EDM Modal Correlation Analysis allows the user to correlate two modal models. The modal models can be EMA model, and/or FEA model. The geometry model and mode shape data from the FEA software or another set of mode shape data from EMA can be imported. A modal mapping procedure is executed to match the EMA and FEA models. After this matching procedure, the new mode shape information from FEA is interpolated and the FEA modal parameters are displayed alongside with EMA results. Finally, to observe the correlation between the results from two methods, a Cross-MAC matrix is calculated and shown
